监控数据库
KubeBlocks 提供了强大的可观测性能力。你可以实时观察数据库的健康状态,及时跟踪数据库,并优化数据库性能。本文档将展示 KubeBlocks 中的数据库监控工具以及它们该如何使用。
测试/Playground 演示场景
启用监控引擎
KubeBlocks 以引擎形式集成了许多开源监控组件,如 Prometheus、AlertManager 和 Grafana,并采用定制的 apecloud-otel-collector 组件收集数据库和宿主机的监控指标。您可在测试或 demo 环境使用这些引擎。在部署 KubeBlocks Playground 时,所有监控组件都会默认启用。
prometheus:包括 Prometheus 和 AlertManager 两个监控组件。grafana:包括 Grafana 的监控组件。victoria-metrics:采集多种数据源的指标,并存储到 VictoriaMetrics。victoria-metrics-agent:采集多种数据库指标,并对采集到的指标进行重新打标、筛选,随后存储到 VictoriaMetrics 或通过 Prometheusremote_write协议或者 VictoriaMetricsremote_write协议存储到其他存储系统。alertmanager-webhook-adaptor:包括消息通知扩展组件,用于扩展 AlertManager 的通知能力。目前已经支持飞书、钉钉和企业微信的自定义机器人。apecloud-otel-collector:用于采集数据库和宿主机的指标。
步骤:
以下示例展示了启用 prometheus 引擎。您可以将 prometheus 替换为其他监控引擎的名称,以开启对应的引擎。
(可选)添加 KubeBlocks 仓库。如果您通过 Helm 安装 KubeBlocks,可直接执行
helm repo update。helm repo add kubeblocks https://apecloud.github.io/helm-charts
helm repo update查看引擎版本。
helm search repo kubeblocks/prometheus --devel --versions安装引擎。
helm install prometheus kubeblocks/prometheus --namespace kb-system --create-namespace验证该引擎是否安装成功。
状态显示为 deployed 表明该引擎安装成功。
helm list -A
>
NAME         NAMESPACE   REVISION    UPDATED                                 STATUS      CHART                APP VERSION
......
prometheus   kb-system   1           2024-05-31 12:01:52.872584 +0800 CST    deployed    prometheus-15.16.1   2.39.1
开启集群监控功能
监控功能开启后,开源或自定义 Exporter 将会注入,Prometheus 服务器将自动发现该 Exporter,并定时抓取监控指标。
如果您在创建集群是关闭了监控功能,可执行以下命令再次开启。
kubectl patch cluster mycluster -n demo --type "json" -p '[{"op":"add","path":"/spec/componentSpecs/0/disableExporter","value":false}]'
(可选)如果您暂时不需要监控功能,可执行以下命令停用该功能。
kubectl patch cluster mycluster -n namespace --type "json" -p '[{"op":"add","path":"/spec/componentSpecs/0/disableExporter","value":true}]'
您也可通过编辑 cluster.yaml 文件开启/停用监控功能。
kubectl edit cluster mycluster -n demo
......
componentSpecs:
  - name: mysql
    componentDefRef: mysql
    enabledLogs:
    - error
    - general
    - slow
    disableExporter: false # 修改该参数值
查看监控大盘
使用 KubeBlocks 提供的 Grafana 引擎查看监控大盘。
获取 Grafana 引擎的用户名和密码。
kubectl get secret grafana -n kb-system -o jsonpath='{.data.admin-user}' |base64 -d

kubectl get secret grafana -n kb-system -o jsonpath='{.data.admin-password}' |base64 -d
执行以下命令连接 Grafana 大盘。
kubectl port-forward svc/grafana -n kb-system 3000:80
>
Forwarding from 127.0.0.1:3000 -> 3000
Forwarding from [::1]:3000 -> 3000
Handling connection for 3000
打开浏览器,输入
127.0.0.1:3000,跳转至大盘界面。输入第 1 步中获取的用户名和密码,即可访问。
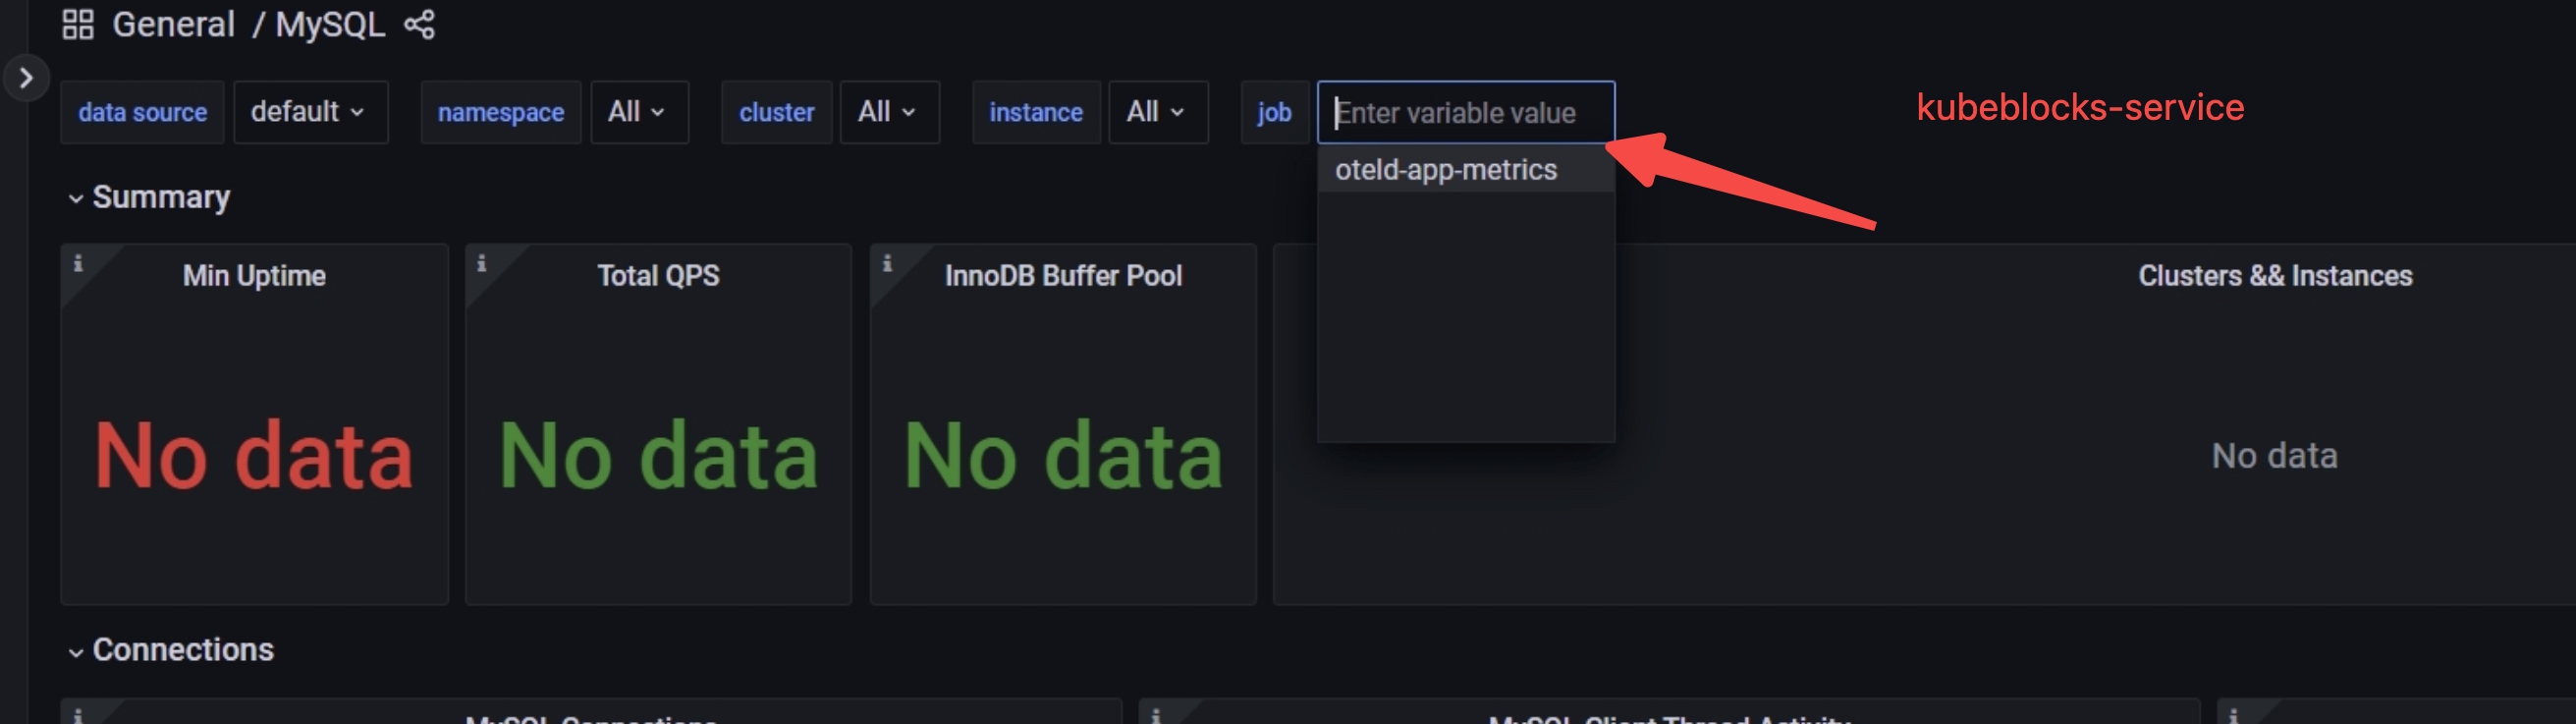
如果大盘中无数据,您可以检查界面中的 job 是否为 kubeblocks-service。如果不是,可在 job 框中输入 kubeblocks-service,回车后再次查看。
(可选)开启远程写(Remote Write)
KubeBlocks 支持 victoria-metrics-agent 引擎,支持用户将数据远程写入虚拟机中,相较于 Prometheus 原生应用,vmagent 更轻量。
安装 victoria-metrics-agent 引擎。
helm install vm kubeblocks/victoria-metrics-agent --set remoteWriteUrls={http://<remoteWriteUrl>:<port>/<remote write path>}
具体配置信息,可参考 Victoria Metrics 文档.
生产环境
集成监控工具
对于生产环境,强烈建议您搭建您专属的监控系统或者购买第三方监控服务。您可参考监控工具的相关文档,将该工具集成到 KubeBlocks。
开启数据库监控功能
开源或自定义的 Exporter 会在启用监控功能后注入。Prometheus 服务器可以自动发现这个 Exporter 并定期抓取监控指标。
如果在创建集群时禁用了监控功能,请运行以下命令来启用它。
kubectl patch cluster mycluster -n demo --type "json" -p '[{"op":"add","path":"/spec/componentSpecs/0/disableExporter","value":false}]'
如果您需要关闭监控功能,可执行以下命令。
kubectl patch cluster mycluster -n namespace --type "json" -p '[{"op":"add","path":"/spec/componentSpecs/0/disableExporter","value":true}]'
您也可以通过编辑 cluster.yaml 文件开启/关闭监控功能。
kubectl edit cluster mycluster -n demo
......
componentSpecs:
  - name: mysql
    componentDefRef: mysql
    enabledLogs:
    - error
    - general
    - slow
    disableExporter: true # 修改该参数值
查看大盘
您可以通过 Grafana Web 控制台查看相应集群的仪表板。有关详细信息, Grafana 大盘文档。
(可选)开启 remote write
KubeBlocks 支持 victoria-metrics-agent 引擎,使您可以将数据远程写入您的 VM。与原生 Prometheus 相比,vmgent 更轻量并且支持水平扩展。
执行以下命令,安装 victoria-metrics-agent 引擎。
helm install vm kubeblocks/victoria-metrics-agent --set remoteWriteUrls={http://<remoteWriteUrl>:<port>/<remote write path>}
有关详细设置,您可以参考 Victoria Metrics 文档。